Wireshark plugin to work with Event Tracing for Windows
Microsoft Message Analyzer is being retired and its download packages were removed from microsoft.com sites on November 25, 2019. Wireshark has built a huge library of network protocol dissectors. The best tool for Windows would be one that can gather and mix all types of logs...
Welcome Winshark!!!
Winshark is based on a libpcap backend to capture ETW (Event tracing for Windows), and a generator that will produce all dissectors for known ETW providers on your machine. We've added Tracelogging support to cover almost all log techniques on the Windows Operating System.
With Winshark and the power of Windows, we can now capture Network and Event Logs in the same tool. Windows exposes a lot of ETW providers, in particular one for network capture ;-) No more need for an external NDIS driver.
This is a huge improvement in terms of use:
- Enable to mix all kind of events (system and network)
- Enable to use of Wireshark filtering on event log
- Enable to track network and system logs by Process ID!!!
- Enable to capture Windows log and network trace into a unique pcap file!!!
- Capture NamedPipe through NpEtw file system filter driver
If you want to:
Install
Please install Wireshark before. Then just install Winshark.
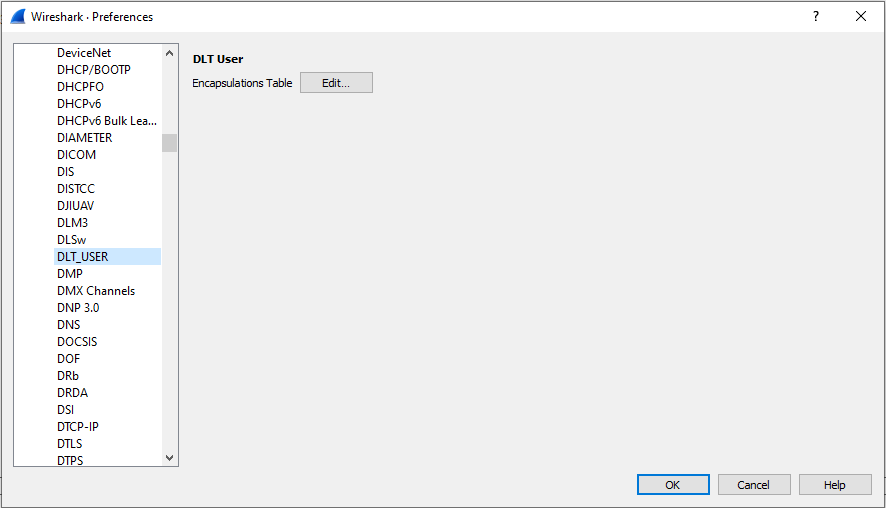
Currently, you have to ask Wireshark to interpret the DLT_USER 147 as ETW. This is because you have not yet a true value from libpcap for our new Data Link. We issued a pull request to have a dedicated DLT value; it is still pending. To do that you have to open Preferences tab under the Edit panel. Select DLT_USER under Protocols and Edit the encapsulations table:
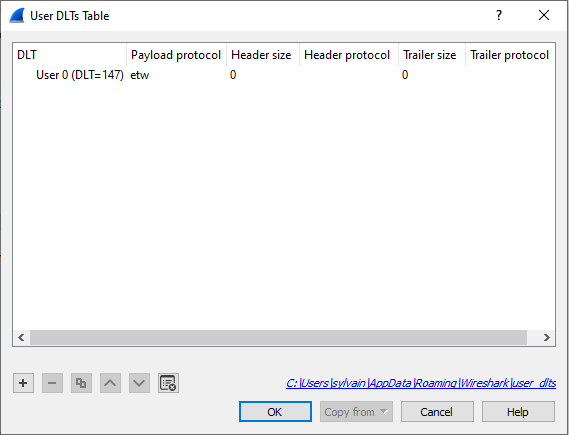
And set etw for DLT = 147 :
Enjoy!
Build
Winshark is powered by cmake:
git clone https://github.com/airbus-cert/winshark --recursive
mkdir build_winshark
cd build_winshark
cmake ..\Winshark
cmake --build . --target package --config release
How does it work
To better understand how Winshark works, we need to understand how ETW works first.
ETW is split into three parts:
- A Provider that will emit log and identified by a unique ID
- A Session that will mix one or more providers
- A Consumer that will read logs emitted by a session
Provider
There is a lot of different kinds of providers. The most common, and usable, are registered providers. A registered provider, or a manifest-based provider, is recorded under the registry key HKLM\SOFTWARE\Microsoft\Windows\CurrentVersion\WINEVT\Publishers. This makes the link between a provider ID and a dll. The manifest is encompassed into the associated dll into a resource name WEVT_TEMPLATE.
You can list all providers registered on your machine using logman:
logman query providers
You can also list all providers bound by a particular process:
logman query providers -pid 1234
Some of them could appear without a name; these kinds of providers can produce WPP or TraceLogging logs.
Session
Sessions are created to collect logs from more than one provider. You can create your own session using logman:
logman start Mysession -p "Microsoft-Windows-RemoteDesktopServices-RdpCoreTS" -ets -rt
logman update MySession -p "Microsoft-Windows-NDIS-PacketCapture" -ets -rt
You can list all active sessions from an admin command line:
logman query -ets

Data Collector Set                      Type                          Status
-------------------------------------------------------------------------------
...
EventLog-Application                    Trace                         Running
EventLog-Microsoft-Windows-Sysmon-Operational Trace                         Running
EventLog-System                         Trace                         Running
...
The command completed successfully.
You can see here some interesting sessions use by the event logger to capture logs from Application and System sessions and from Sysmon.
Consumer
A consumer is a simple program that will read logs from a session. Well-known consumers are:
- Event Logger
logmannetshtracert
And now Winshark!!! Winshark is a simple ETW consumer. The real underlying consumer is libpcap, (wpcap.dll for Windows) which is used by dumpcap.exe which is the process in charge of packet capture.
Wireshark
Wireshark is split into three parts (yes, him too):
Wireshark.exewhich is in charge of parsing and dissecting protocolsdumpcap.exewhich is in charge of capturing packetslibpcap(wpcap.dll) which is in charge of interfacing betweendumpcap.exeand the Operating System
Winshark takes place in the first and last parts. It implements a backend for libpcap to capture ETW events.Winshark works on ETW sessions, this is why you can select an ETW session in place of the Network interface at the start of capture. Then Winshark generates lua dissectors for each manifest-based provider registered on your computer, during the installation step. Winshark is also able to parse trace logging-based providers.
Capture network traffic
To capture network traffic using Winshark, you can use two simple ways:
pktmon (Packet Monitor)
pktmon is an in-box, cross-component network diagnostics tool for Windows. It can be used for packet capture, packet drop detection, packet filtering, and counting (supported from RS5)
(https://docs.microsoft.com/en-us/windows-server/networking/technologies/pktmon/pktmon)
pktmon start -c -m real-mode
you can run pktmon -h for more options (as admin)
For instance: Add a filter for packets
pktmon filter add -t icmp
pktmon filter add -t tcp -p 80
Then launch Wireshark with administrator privileges and select Pktmon interface:

That will start the packet capture:

netsh trace
netsh.exe trace start capture=yes report=no correlation=no
And then create an ETW session associated with the Microsoft-Windows-NDIS-PacketCapture provider:
logman start Winshark-PacketCapture -p "Microsoft-Windows-NDIS-PacketCapture" -rt -etsThen launch Wireshark with administrator privileges and select Winshark-PacketCapture interface:

That will start the packet capture:

Filtering on the process ID
ETW marks each packet with a header that sets some metadata about the sender. One of these is the Process ID of the emitter. This is a huge improvement from a classic packet capture from an NDIS driver. Simply fill the filter field of Wireshark with the following expression:
winshark.header.ProcessId == 1234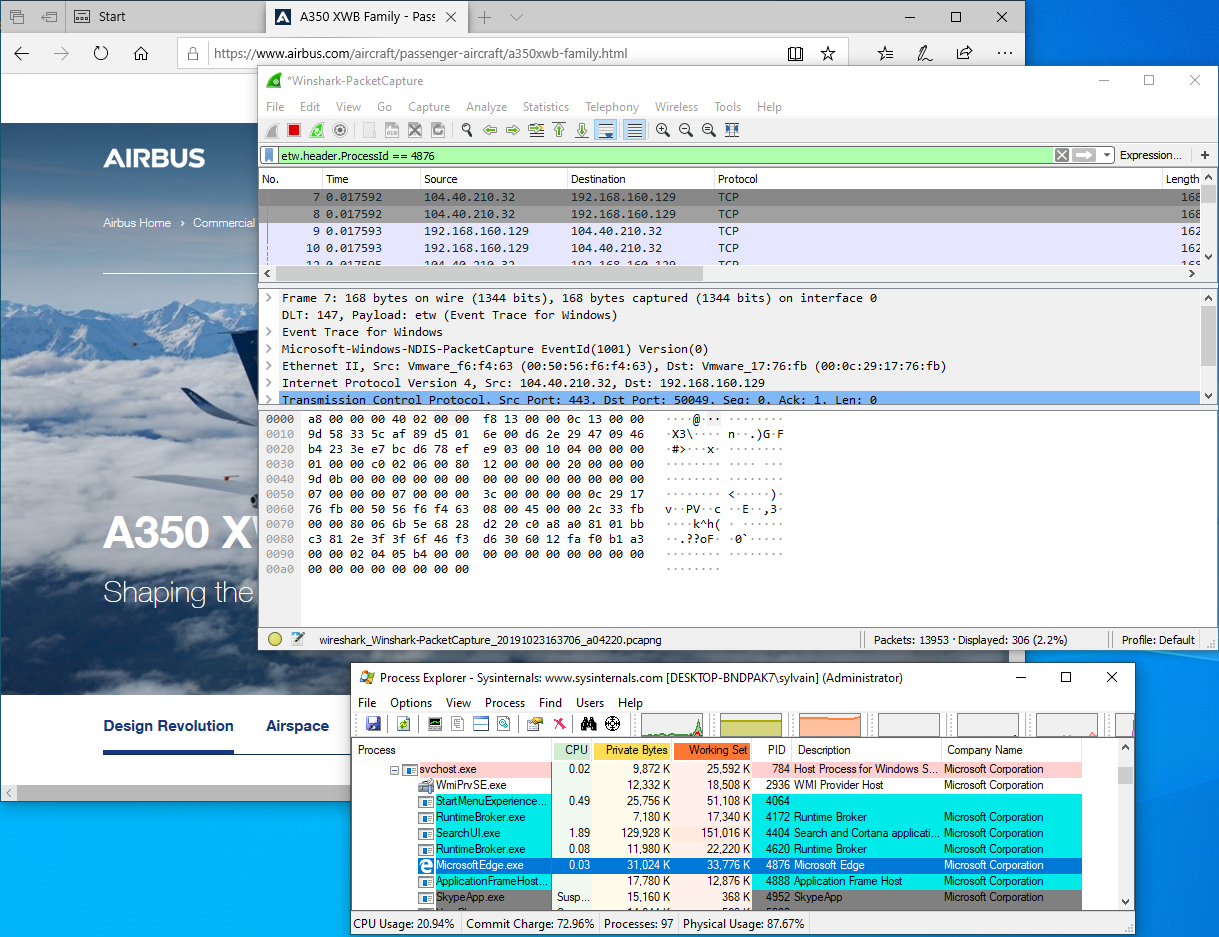
Capturing NamedPipe
@kobykahane provides a file system filter driver that emits an ETW for every action performed on a NamedPipe.
Install
- Pass driver signing check in test mode
bcdedit /set testsigning on
- Install NpEtwSetup.msi
- Reboot
- Update
Winsharkdissector by double-clickingC:\Program Files\Wireshark\WinsharkUpdate.batwithAdminrights
Capture
- Open a
cmd.exeinAdmin mode - Start the driver
sc start NpEtw
- Create an ETW Session
logman start namedpipe -p NpEtw -ets -rt
- Start
Wiresharkand select thenamedpipesession. Enjoy!

SSTIC (Symposium sur la sécurité des technologies de l'information et des communications)
This project is part of a presentation made for SSTIC